Introducing the Live Compliance Dashboard
Introducing the Live Compliance Dashboard
Real-time visibility of compliance status across your entire organisation
We’re excited to introduce the Live Compliance Dashboard – a powerful new addition to Compliance Pod that gives you instant visibility of your compliance position across every site, cluster, and the entire organisation.
Built in collaboration with our customers, this dashboard offers a clear, accurate, and real-time picture of compliance performance, helping you stay ahead of risk, streamline reporting, and support accountability at all levels.
What is the Live Compliance Dashboard?
The Live Compliance Dashboard provides real-time analysis of the status of all scheduled compliance tasks—such as fire alarm tests, water flushing, or electrical inspections—based on the most up-to-date information available in your system.
Each compliance task is assigned an overall status using a straightforward Red–Amber–Green system, depending on the results of ongoing or previous iterations of that task. The dashboard allows you to see which tasks are overdue, in progress, completed, or awaiting action, making it much easier to monitor compliance across multiple sites.
How the Statuses Work
For each task, the dashboard analyses multiple data points to determine its current compliance status. A task can have many iterations running simultaneously—this week’s test may be on time, while last week’s may be overdue, and a ticket from two months ago may still be unresolved.
To keep things simple but meaningful, each task is assigned a single status, based on the iteration posing the highest compliance risk:
- Red – Non-Compliant - At least one iteration of the task is overdue.
- Amber – Compliant In Process - No overdue iterations, but one or more related reactive task tickets (generated by previous iterations of the task) are still open.
- Light Green – Compliant In Testing - No overdue iterations or open tickets, but the current iteration is outstanding (due soon, but not overdue).
- Dark Green – Compliant No Activity - No overdue iterations, no active tickets, and no current iterations outstanding. Nothing is currently in flight for this task.
This hierarchy ensures that the dashboard prioritises the most critical risks. If even one overdue task exists for a site, you’ll know immediately—and you’ll know where to focus your attention.
Visual, Interactive Reporting
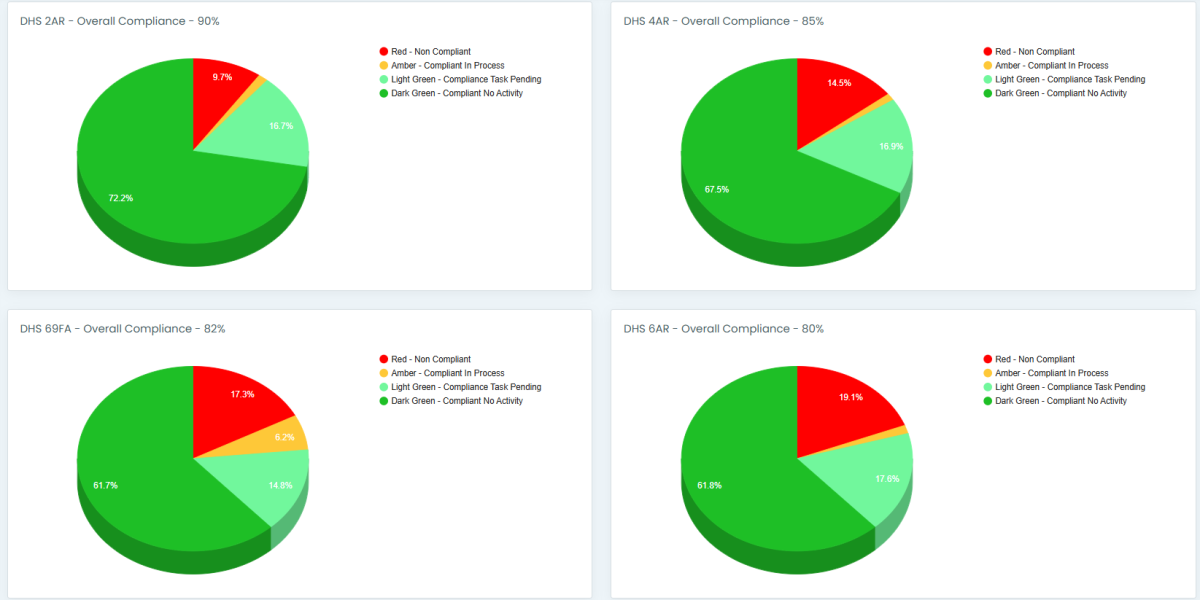
The dashboard presents this information in drillable pie charts that provide a snapshot of compliance status across:
- The whole organisation
- Individual site clusters
- Each school or college
Clicking on any segment of the chart opens a detailed view of the tasks in that category, where you can explore:
- Task configuration and history
- Completed and outstanding iterations
- Related reactive tasks and follow-up actions
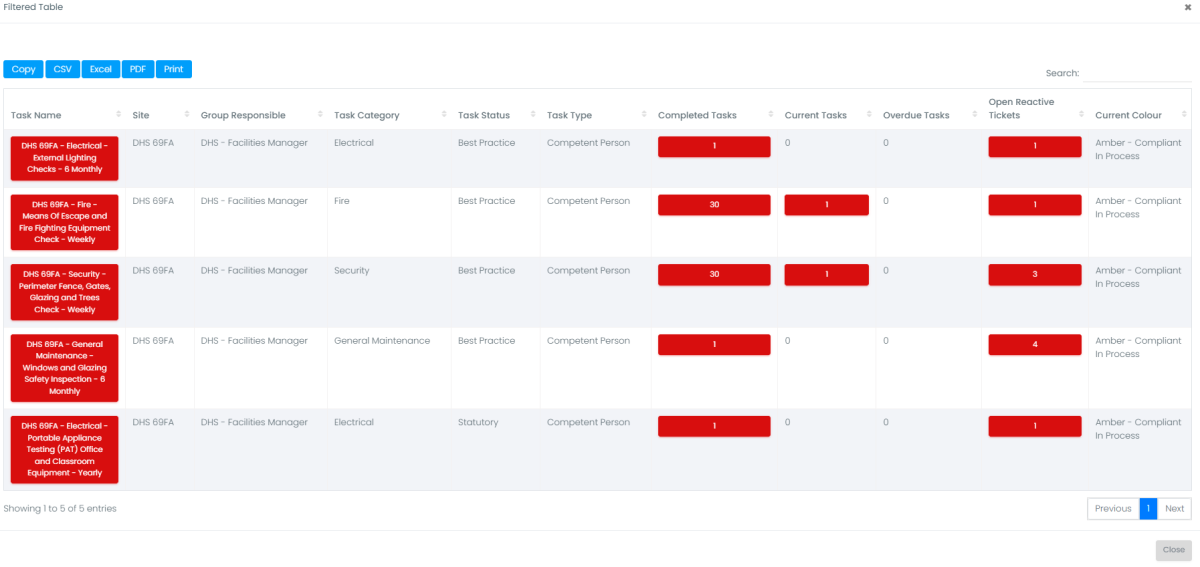
This means the dashboard isn’t just a reporting tool – it’s a new way to navigate the system, starting from compliance risk and drilling down to specific task data.
Flexible, Role-Based Access
The dashboard is user-permission sensitive, meaning it only displays data for the sites a user has access to. Whether you’re a Trust-level compliance lead, a cluster manager, or a site-level caretaker, you’ll only see relevant data—no more, no less.
This makes it easy for users at any level of the organisation to take ownership of compliance at their sites, without compromising sensitive data from elsewhere.
Customisable and Filterable
The dashboard is designed to be highly configurable, with filters for:
- Task name
- Site or site type (e.g. Primary, Secondary, Trust or Campus, Building)
- Group responsible for completing the task
- Compliance category (e.g. Fire, Asbestos, Water)
- Task status (Statutory, Best Practice, PPM, etc.)
- Contractor responsible for completing the task
- Task priority
You can also configure which task statuses should be included in the dashboard, so that operational tasks (like meter readings) can be excluded from compliance analysis, while statutory and best-practice activities are highlighted.
Time-Based Views
By default, the dashboard shows the current real-time compliance status, but you can also filter by date to see what the status was at any previous point in time. This is ideal for audit preparation, reporting to governors or senior leadership, and tracking improvements over time.
Why It Matters
The Live Compliance Dashboard was developed in response to a real challenge faced by our customers: the need for a clear, up-to-date view of compliance, without having to dig through task lists, spreadsheets, or incomplete logs.
With this dashboard, you can:
- Instantly identify areas of non-compliance
- Track trends and risks across multiple locations
- Give every stakeholder the insight they need
- Demonstrate control and accountability in audits and inspections
See It in Action
If you're already using Compliance Pod, speak to your account managers to get the dashboard enabled and configured for your sites.
If you're new to Compliance Pod, would you like a tailored walkthrough of the Live Compliance Dashboard for your organisation?
Click the link below, book a consultation and we’ll be happy to show you how it works in your context.
Find Out more: click here
Want more insights like this?
Stay up to date with the latest compliance and facilities management guidance for the education sector.
Read More Articles